
Developing the Competitiveness Index

For me, the need to develop a new index for football league competitiveness was twofold. Firstly, I was sick of hearing people talking about which leagues were or weren't "competitive" without any substantive evidence to support those gut feelings. And secondly, I just wasn't happy with the way that I'd seen it calculated elsewhere.
If you haven’t read the first part of this article, you can find it here. It has the results, and is probably the less boring bit to most people. Delve ye no further here unless you actually want to know how this particular statistical sausage got made.
So before trying to put the index together I thought it would be useful to list out some principles to (aim to) adhere to:
-
* The calculation should produce a single value allowing league seasons to be easily compared.
-
* The calculation should not favour teams with more or fewer teams in their league.
-
* The number of games played in the league season should not skew the final calculation.
-
* The final results of all teams in the league will have a bearing on the calculation, not just those at the top.
-
* Previous years’ results have zero bearing on the calculation of the current year’s result.
-
* The closeness of the top of the table is more important than the closeness of the bottom of the table.
-
* Any non-match related points deductions (i.e. for fan troubles, club administration, financial “irregularities”, corruption etc.) should be ignored.
-
* Any post-league season structures (i.e. play-off tournaments, champions groups, cross-league relegation play-offs) should be ignored.
-
* The calculation should be quick to do, and achievable based on the final league table alone.
With these principles as a guideline, it’s clear why we wouldn’t solely use the gap at the top of the table to define league competitiveness. It’s one often used to support gut feeling of competitiveness levels, but it’s very possible to have a league where a couple of teams are competitive at the top of the table, but the others aren’t. One of the approaches I’ve seen for calculating competitiveness elsewhere on the Internet is to just use a standard deviation calculation to measure the dispersion of the set. If the teams are more spread out then that means less competitive, right? It’s a decent starting point, but it’s not a good representation by itself. It’s a bit more tricky to explain why, so here’s an example. Standard deviation calcs are in blue, and our eventual index is in red:
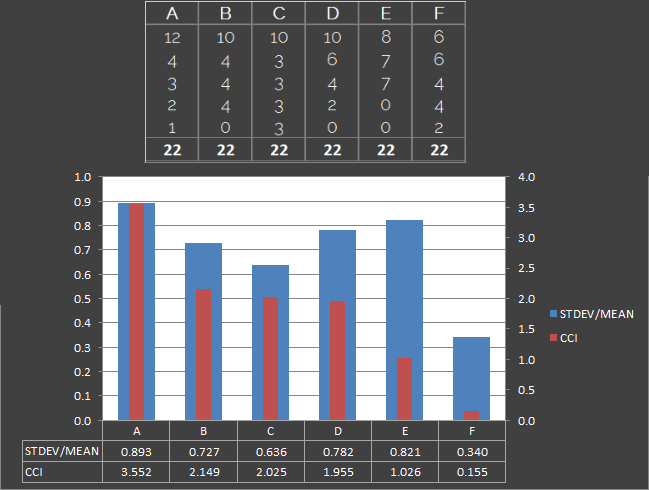
Here we have six league tables, A to F, each with a total of 22 points shared between 5 teams. We’ll ignore what combination of results brought us to this point (as in some cases they don’t make sense) and focus on the fact that all leagues have the same number of points shared between the teams. The leagues are listed in order of competitiveness in my own view, from A (least competitive) to F (most competitive):
A – 8 point gap at the top of the table. One team way ahead of the others. Very uncompetitive.
B – Only a 6 point gap. Still little competition for the team at the top. One of the teams is on zero points, and is not competitive with the rest of the pack.
C – 7 point gap at the top, but all other teams are competitive with each other.
D – 4 point gap. A lot closer, but there is still a lot of variance in quality.
E – Only 1 point separates the top 3 teams, though there are two teams at the bottom of the table who are nowhere near.
F – No points separating the top two, and only four points between top and bottom. Every team has points on the board. Highly competitive.
The chart shows that although the standard deviation calculation gives a rough approximation of competitiveness, it falls apart in situations where the top and bottoms of the league have a clear separation (see multimodal distribution). We also need to look at the variance from the maximum value (i.e. the league winners) of all other teams, which also solves a potential issue with outliers. If a team finishes the season on zero points, though it will affect the competitiveness of a league to a degree, it doesn’t make the league uncompetitive as a whole. The other n-1 teams could still have an exciting and competitive season, with only their matches against the zero pointers being uncompetitive. In the reverse scenario though (with a team winning every match), the rest of the league could still be close, but if the league winner is a foregone conclusion then the season could not be considered competitive. This is the difference between scenario E and C respectively in the examples above.
Our calculation will only look at the league points achieved in order to keep the calculation easy to achieve. It is going to factor in the deviation from the mean, but balance that against the gap at the top of the table and the average points lag between the leader and every other team in the league. This will all be weighed against the average number of points achieved so not to favour leagues where more matches have been played. This meets all of the criteria that I set out at the start. Now at this stage I’ll apologise in advance as maths is not my first language so there may be a notation mistake or two in the following, but this leads us to the following calculation:
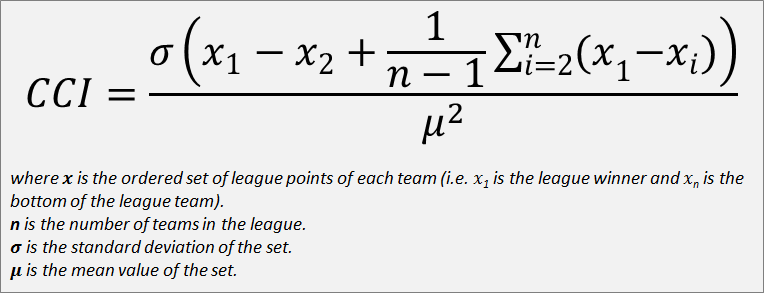
The calculation went through a few ideas and iterations before I settled on the above, which I believe gives a pretty good indication of the overall competitiveness as a single number. To make the calculation a bit more comprehensible, we can simplify it into the following:
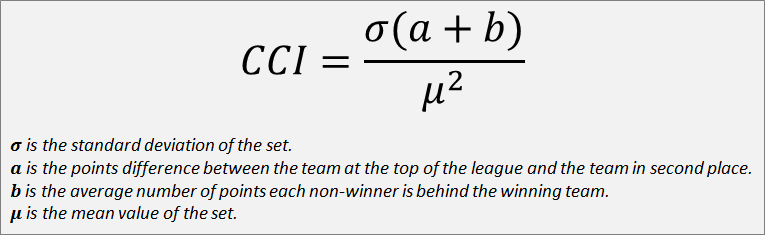
Hopefully from that explanation you’ll have enough info to do the calculation yourself. I don’t think there’s any simpler way to express the equation without it getting extremely wordy, but if you’re a maths boffin and can see a simpler way to express this equation then I’d love to hear what you’ve got.
I did my testing with randomly generated league tables, giving each team weighted (but random) percentage chances of winning matches against other randomly generated teams based on their randomly generated stats. It gave a pretty realistic looking league table at the end of it, and also allowed me to cheer on such giants as “Team 17” who I nicknamed “The Worms“. In order to use real data but to stay away from anything too influential, I also used past results from the third tier of Greek football, the Gamma Ethniki. It was a league where I hadn’t even heard of any of the teams, and had no idea if it was considered to be competitive or not by the people who watched it; I only had the results themselves to work with.
So with the calculation developed, all that was left was to grab some league results from Wikipedia, and pass them in. The results were taken from the “League table” section of each top league’s page for that particular year, with any deducted points being manually added back on. I don’t think there are any mistakes in the results, but it’s definitely possible that a deducted point or two were not accounted for in the data. You have the means to calculate it yourself now, so please feel free to double-check the results and let me know if you see any issues.
“And what’s the CCI name about?” I hear you think. It’s the Cruickshank Competitiveness Index not solely due to vanity, but I don’t want people to think that this is the only or conclusive way to calculate competitiveness for a league. This is simply my interpretation of the problem. Don’t like the results? Go develop your own solution, or alternatively just continue with your day unimpeded. Think it’s decent? Use it to win arguments and back up your statements with the numbers that it provides. And please please have fun telling people how wrong they are when they say League X is or isn’t competitive. For me.